IoT Hub Sensor Dashboard

Year
2026
Client
Personal Project
Service
UI Design · Front-End Prototyping · Motion Design · Data Visualisation · Interaction Design
A mobile-first IoT dashboard prototype built in React with Framer Motion and Recharts.
© IoT Hub Sensor Dashboard
Typography as the Core Design Decision
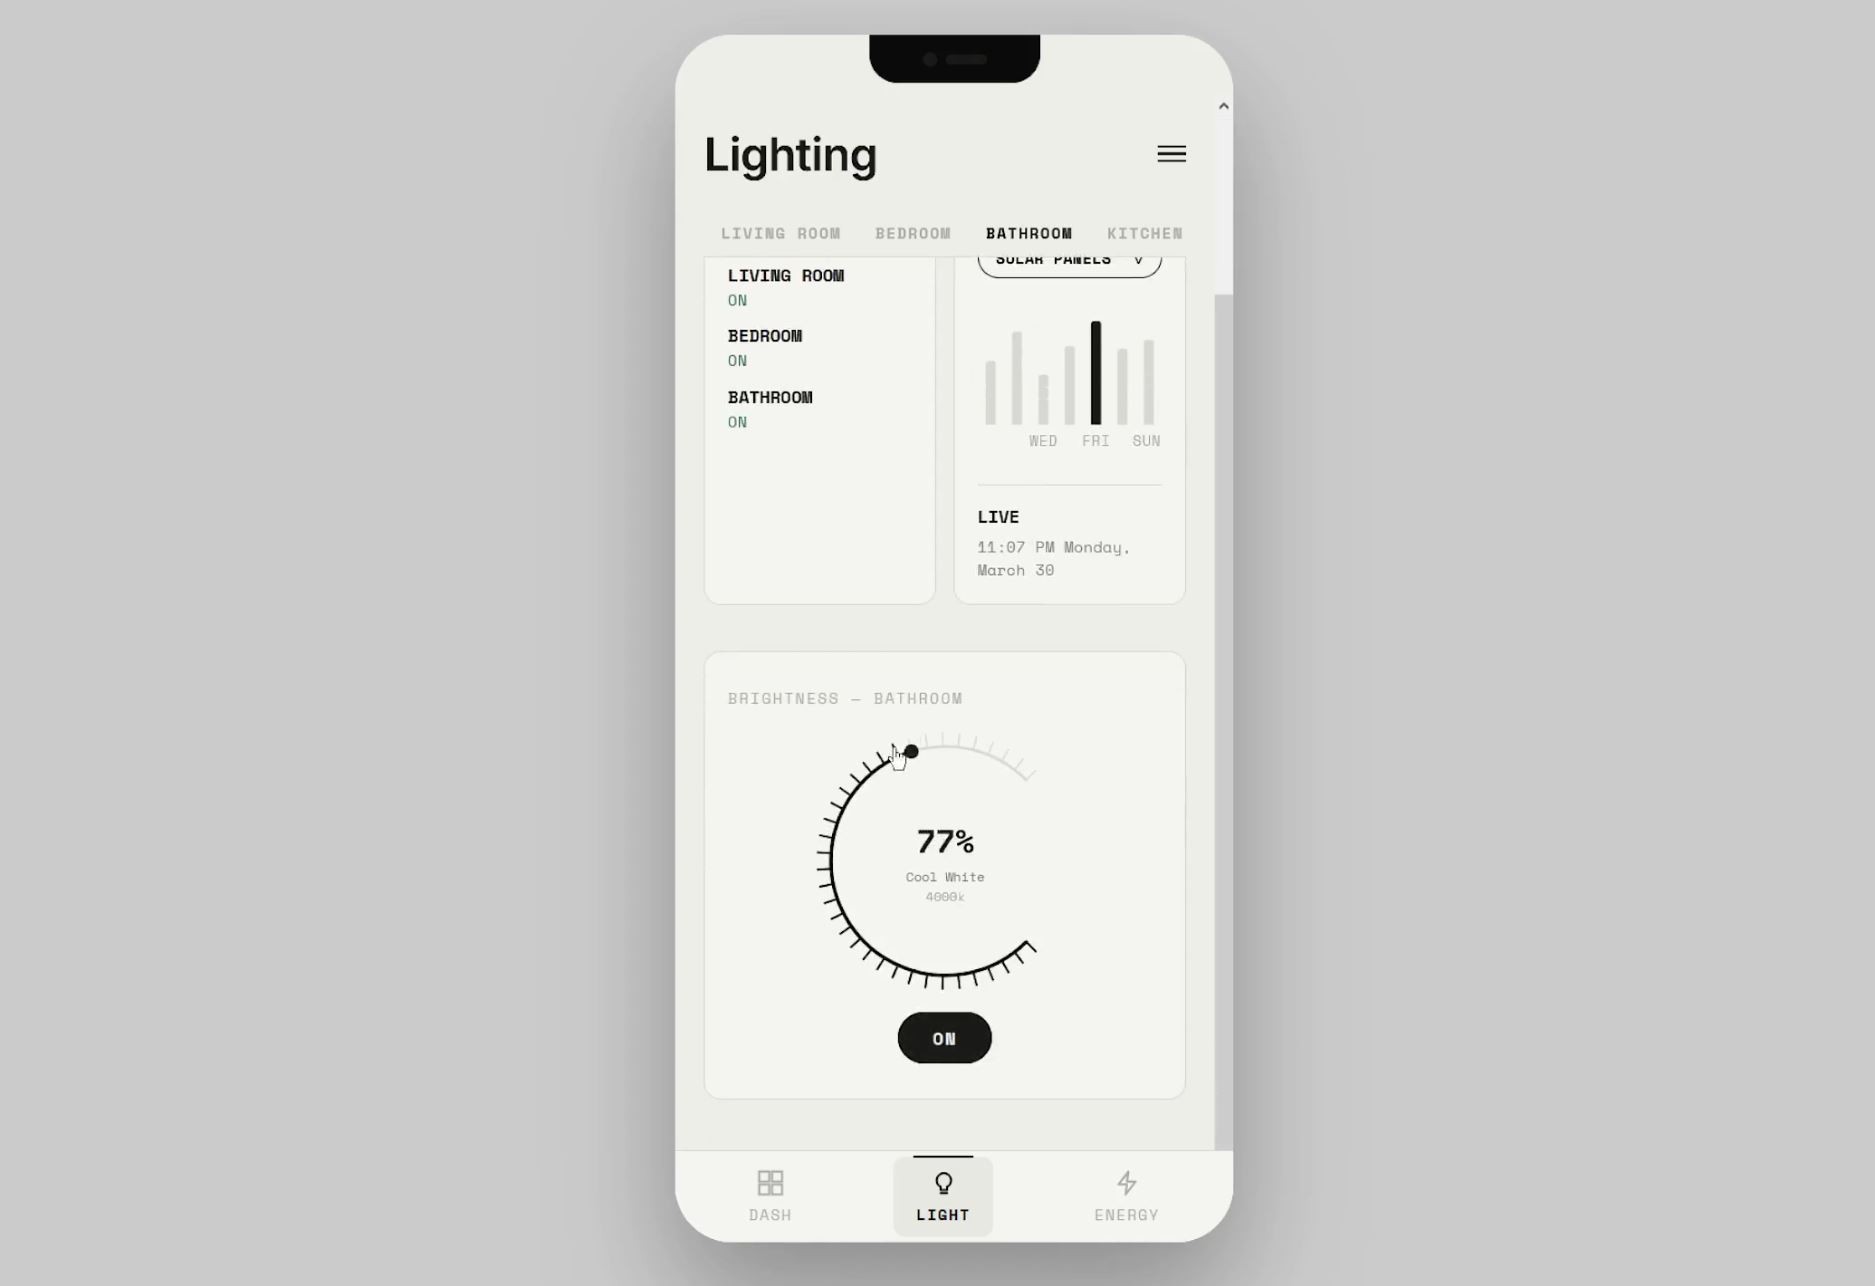
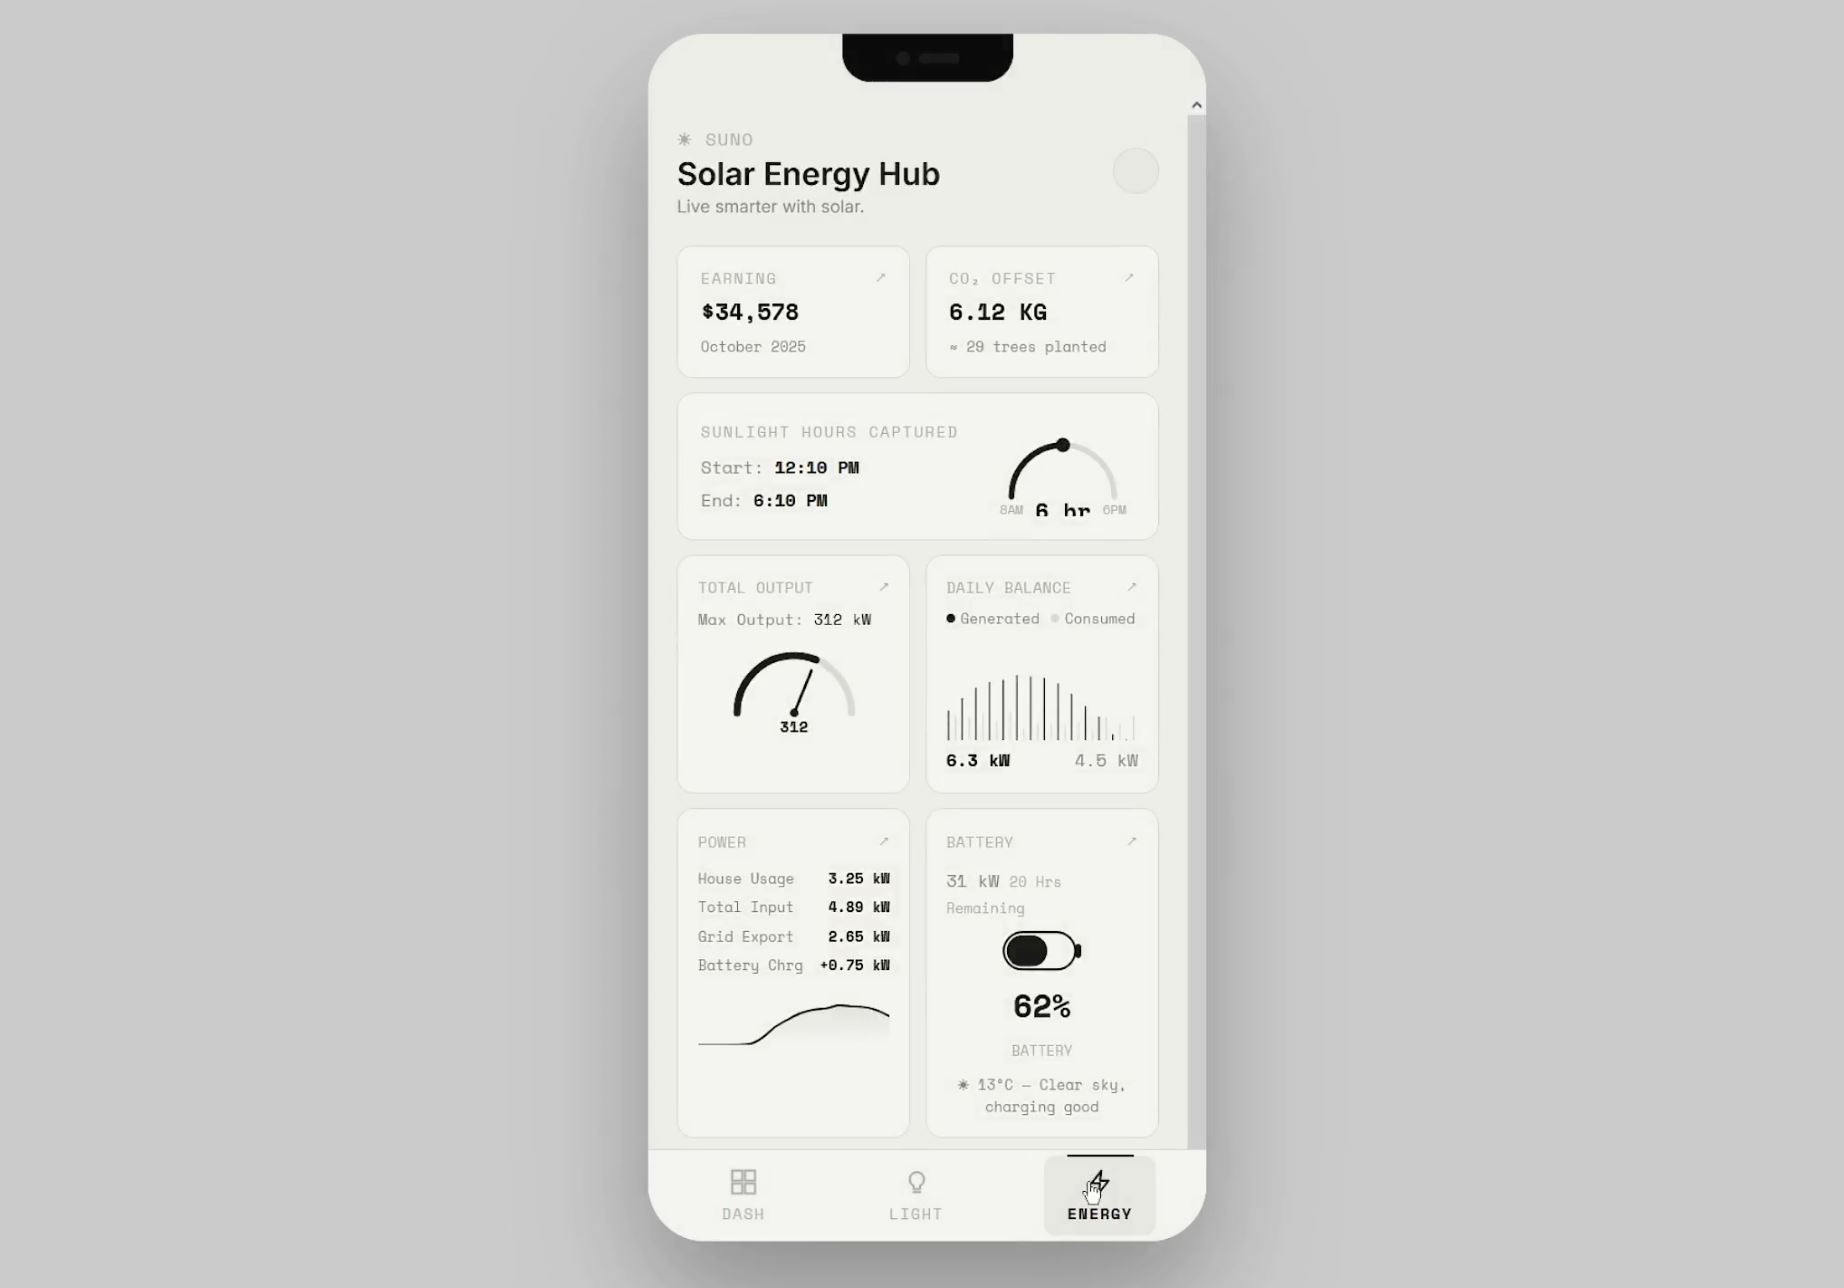
The central design challenge was not layout or colour — it was type. The prototype uses two typefaces with deliberate intent: Space Mono for all data, labels, and system identifiers; Inter for anything conversational. The tension between them is the aesthetic. Push too far into monospace and the interface reads like a CLI tool. Pull back too far and you lose the retro-instrument quality entirely. The balance is found at the level of individual elements: the 80px temperature display is Space Mono at maximum weight, while the analytics copy on the lighting screen is Inter at regular weight — same screen, different registers. Getting that hierarchy right took longer than building the components.
Motion as Data Feedback
Every animation in the prototype is functional, not decorative. The temperature chart scrolls a 60-point rolling window updated every two seconds — the line doesn't replay an entrance animation on each tick, it simply extends, giving the sensation of a live instrument. Number transitions use Framer Motion's spring physics so metric card values ease toward new readings rather than snapping, preserving the sense of a continuous signal rather than a discrete update. The circular dimmer on the lighting screen uses SVG geometry and pointer event tracking to render a draggable arc that updates brightness in real time. The add-sensor sheet springs up from the bottom with a spring easing that matches the physical weight of a bottom drawer. None of these are gratuitous — each motion is doing the work of communicating system state.
Norman Foster Pompidou Exhibition